Is it healthy
The five cards and the two panels beside them: how much went through, how much of it failed, how close the latency and error budgets are to being spent, and how the last few intervals compare.
- SLO Burn Rates
- Request Latency (recent)
effgen serve already carries its web surfaces: 12 panels of live traffic, cost and traces at /dashboard, and a browser playground at /playground that runs a model, shows the tools it called and hands the run back as curl, cli, python. Both are 8 files inside the package — 184 kB, no CDN, no external font, nothing fetched when the page opens.
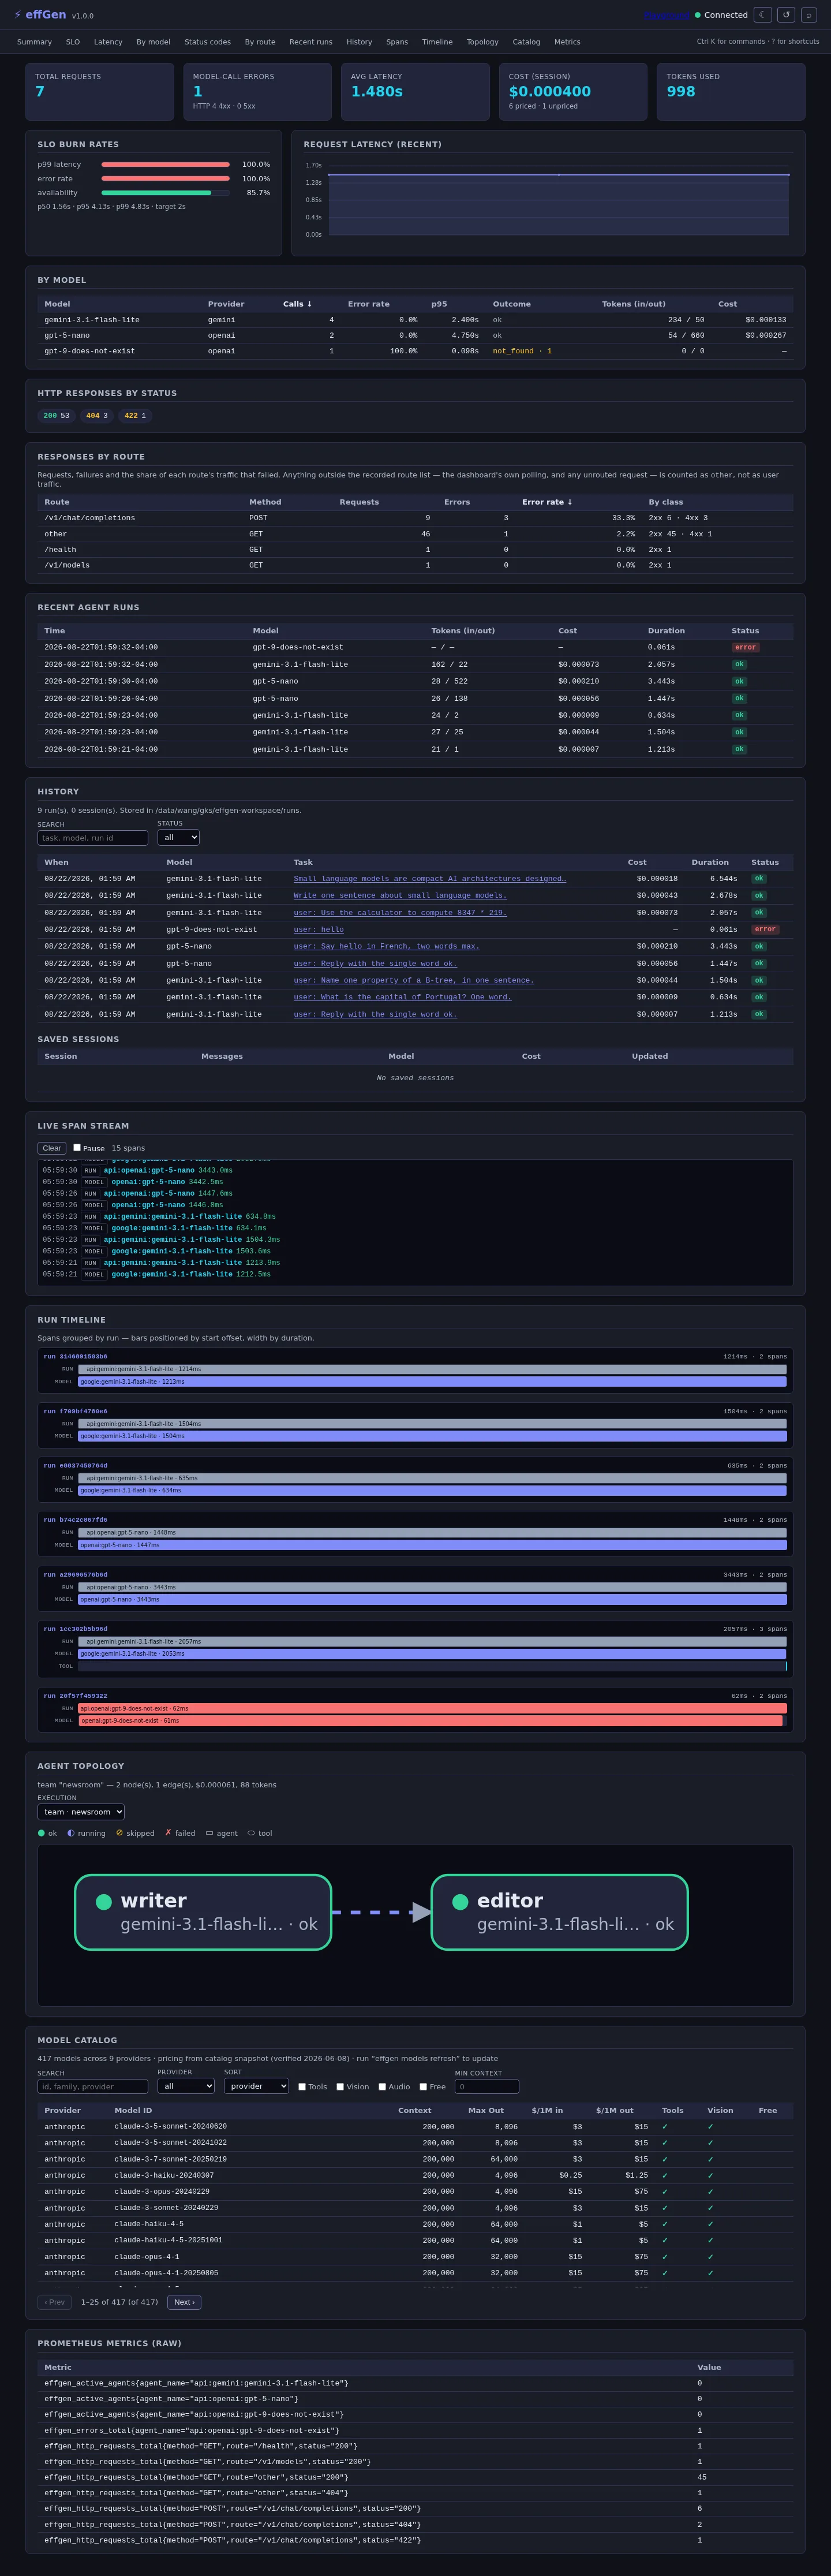
effgen serve --port 8000 · the whole page at 1440px, after the traffic below went through the server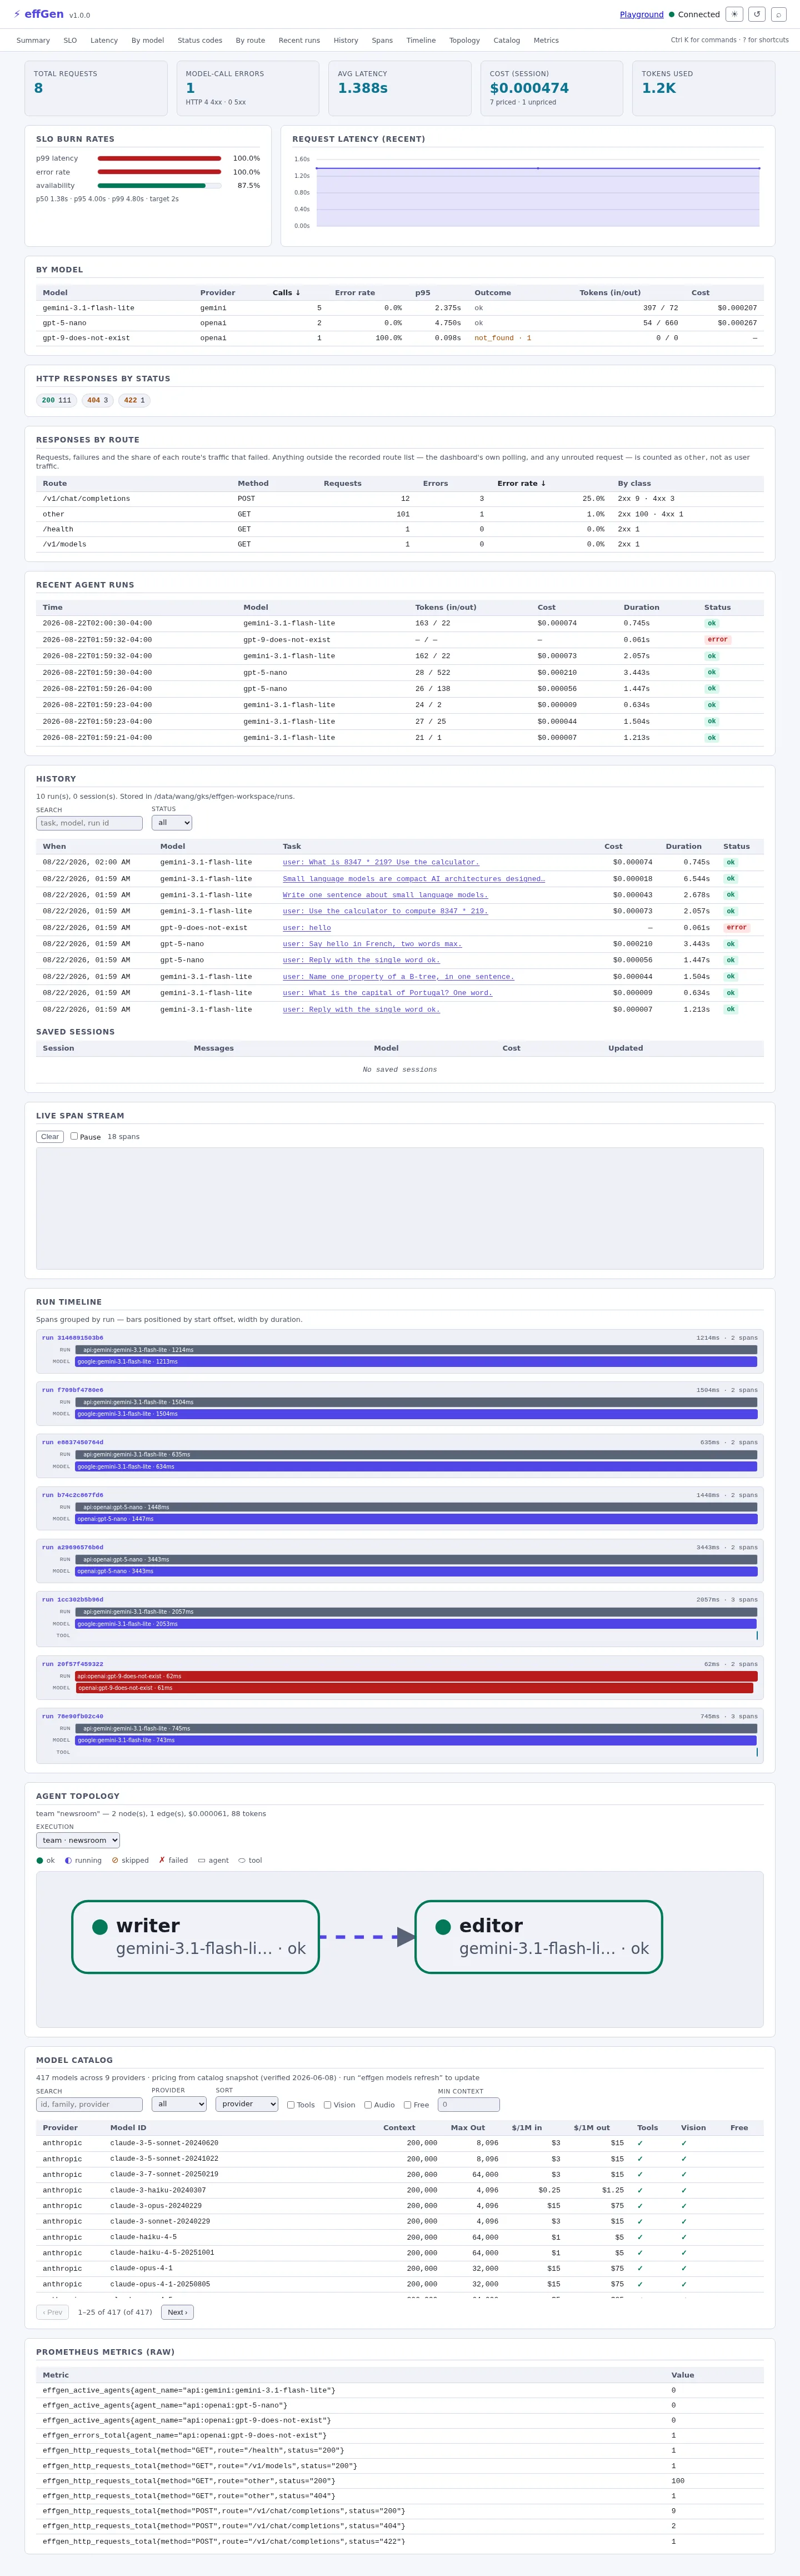
effgen serve --port 8000 · the whole page at 1440px, after the traffic below went through the serverEvery figure on this page is a screenshot of a running server, taken with a browser after real traffic went through it: six calls that succeeded, one naming a model that does not exist, one body with no messages field, a probe of a route that is not served, and a two-agent team run. That is why the error columns have numbers in them and the cost column has a — in it. The counters that include the dashboard’s own polling keep climbing while a page is open, which is why they differ between one figure and the next. Nothing here is a mock-up.
Figures from different sources are never added together. The per-model rows are scoped to a (model, provider) pair, spend that could not be matched to a row is stated below the table rather than spread across it, and the route panel carries the denominator that turns a status code into an error rate.
The five cards and the two panels beside them: how much went through, how much of it failed, how close the latency and error budgets are to being spent, and how the last few intervals compare.
One row per model and provider, so a model served by two providers reports each provider's own latency tail and each provider's own spend.
A status code on its own says a request failed; it does not say which route failed or why. These two panels carry the denominator.
The runs this process has seen, the durable history behind them, and the spans each run produced — live, and laid out on a timeline.
A team or a workflow as a graph, and the catalog every model id on the page resolves against.
Every registered Prometheus metric and its current value, unsummarised.

GET /dashboard/data.json → .metrics
— where its cost would be and not_found · 1 where its outcome is. Model, Provider, Calls, Error rate, p95 and Cost all sort on click.GET /dashboard/data.json → .by_modelcurl -s http://127.0.0.1:8000/dashboard/data.json | jq '.by_model[0]'{
"model": "gemini-3.1-flash-lite",
"provider": "gemini",
"calls": 4,
"errors": 0,
"input_tokens": 234,
"output_tokens": 50,
"outcomes": {
"ok": 4
},
"top_error": null,
"top_error_hint": null,
"error_rate": 0,
"p95_latency_s": 2.4,
"cost_usd": 0.000133
}outcomes tallies the recorded outcome label verbatim, top_error names the most frequent failure, and top_error_hint is the same remediation sentence the command line prints for that class — so the panel says what to do, not only that something went wrong.
Spend that cannot be attributed to any row is reported apart, in unattributed_cost_usd, so the cost column always sums to money actually attributed.

GET /dashboard/data.json → .by_status
other rather than being folded into a route it did not touch.GET /dashboard/data.json → .by_route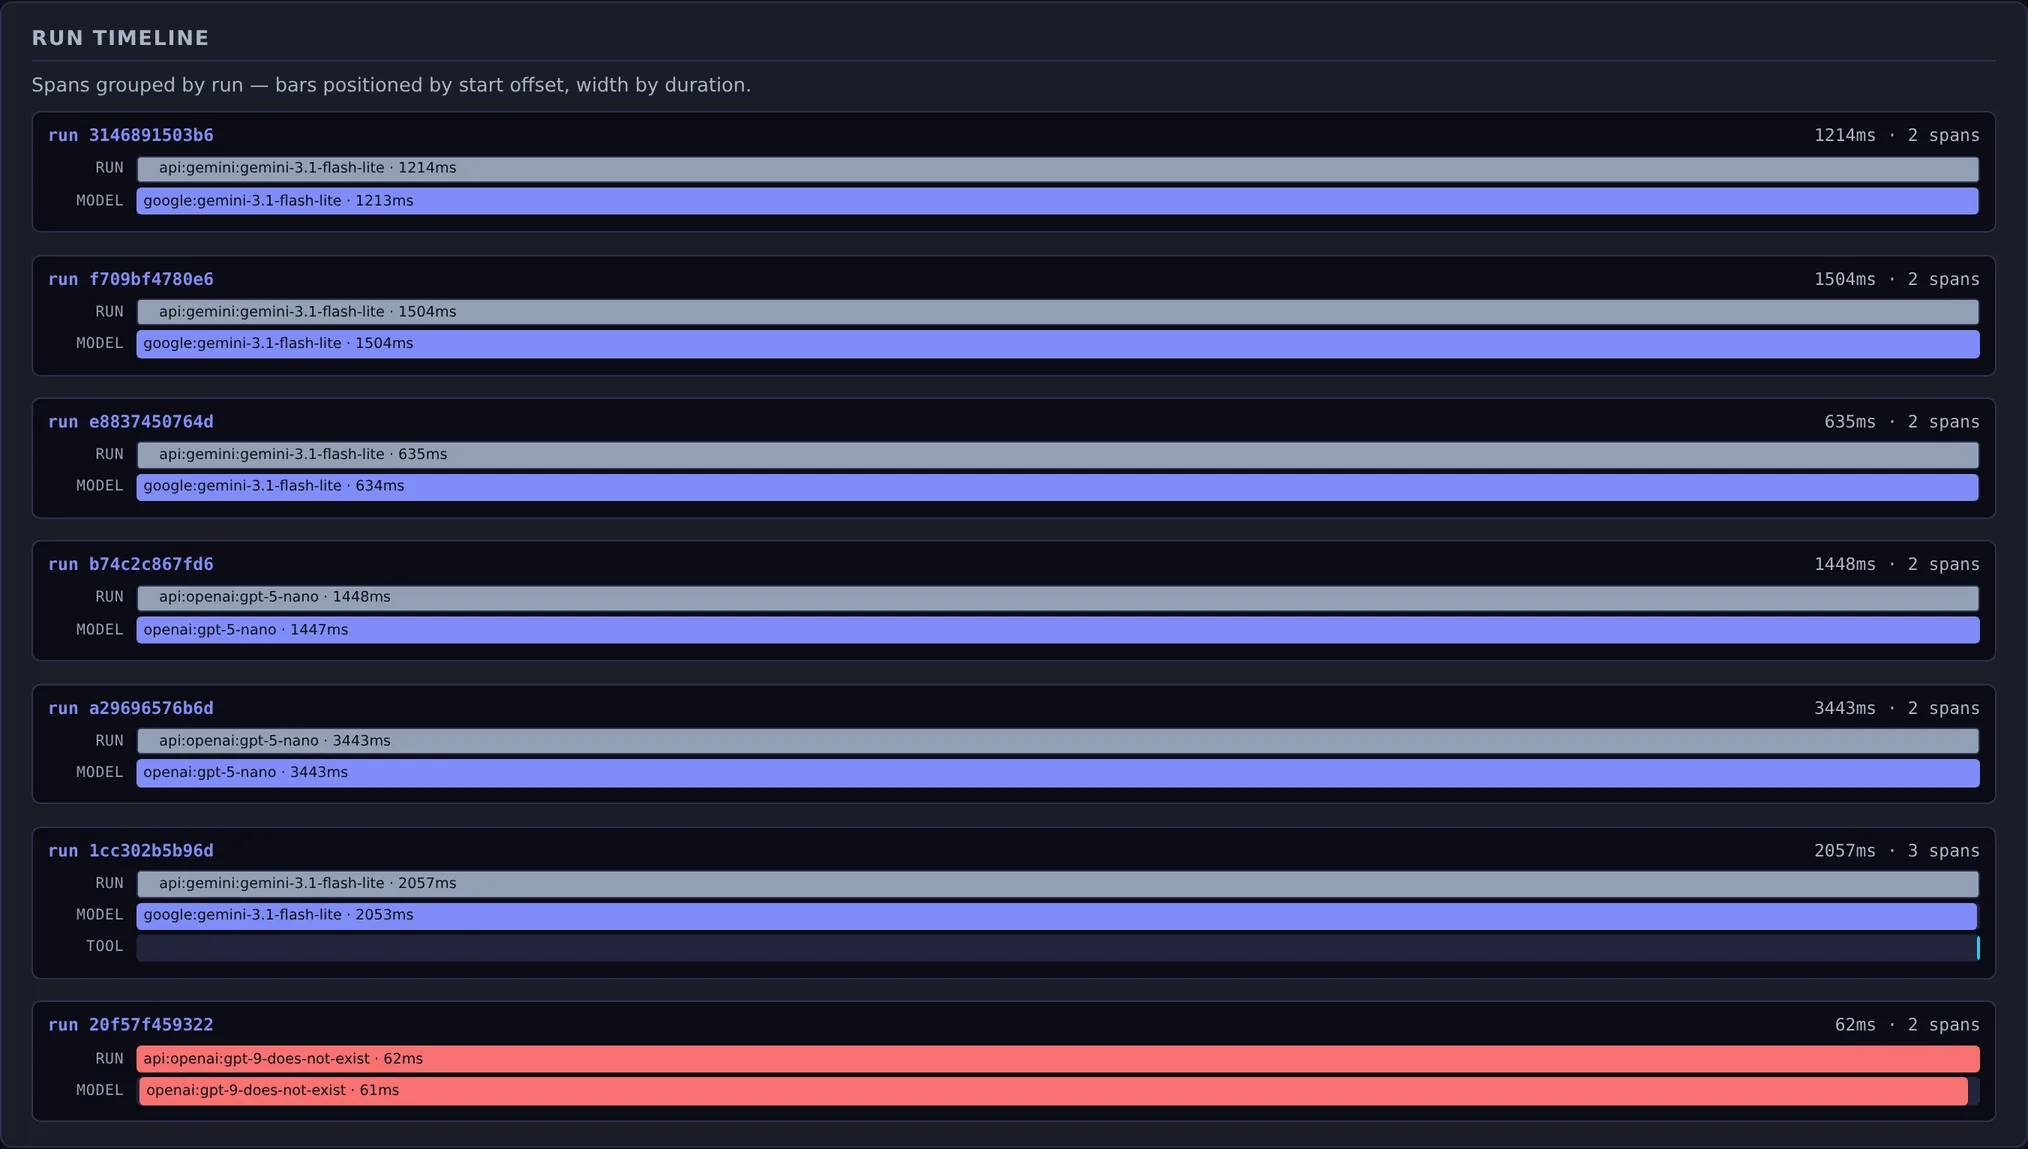
GET /dashboard/data.json → .recent_spans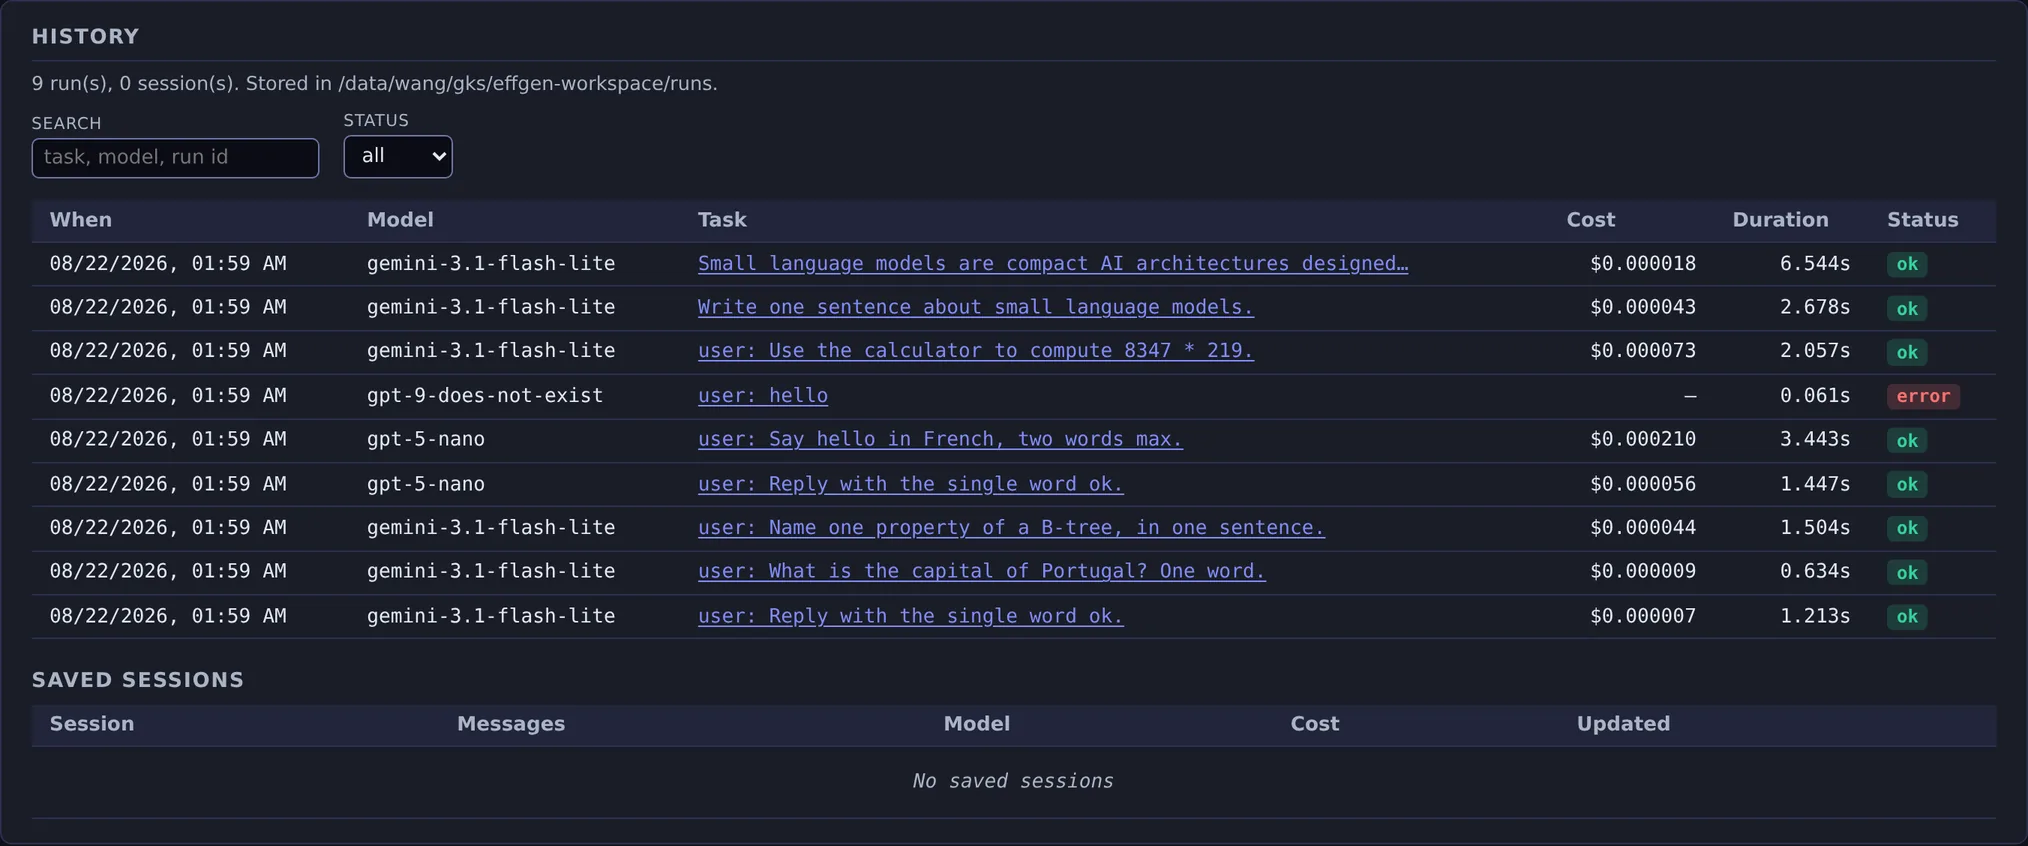
effgen runs and effgen sessions read, so a run started from a script shows up here.GET /dashboard/history.json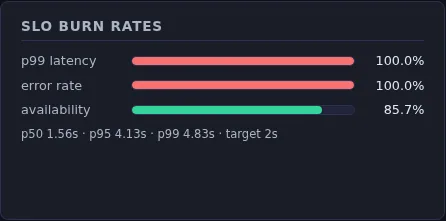
GET /dashboard/data.json → .slo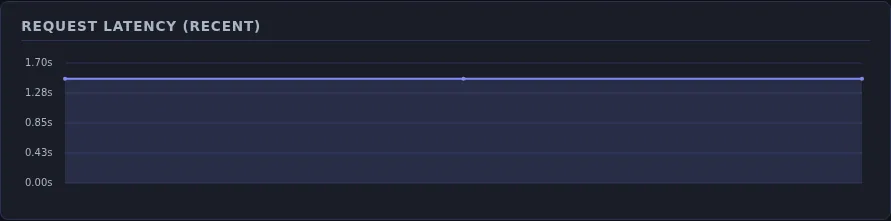
GET /dashboard/data.json → .metrics.avg_latency_s| Route | Type | Description |
|---|---|---|
/dashboard/data.json | — | The five cards, the SLO burn, the per-model rows, the status and route breakdowns, the recent runs and the buffered spans. Polled every five seconds. |
/dashboard/spans | — | Server-sent events, one JSON object per span, pushed as they are recorded. |
/dashboard/catalog.json | — | Every model the catalog knows, for the catalog panel. |
/dashboard/history.json | — | Stored runs and saved sessions, for the history panel. |
/dashboard/topology.json | — | Recent team and workflow executions as node-link graphs. `?limit=` bounds it. |
Every one is same-origin. The page issues no other request.
Pick a model or a preset, attach tools, set temperature and a token cap, and run it — streamed or not. The answer arrives with its tokens, its cost and its latency, the tools that ran are listed with what they were given and what they returned, and the whole thing is offered back as curl, cli, python.
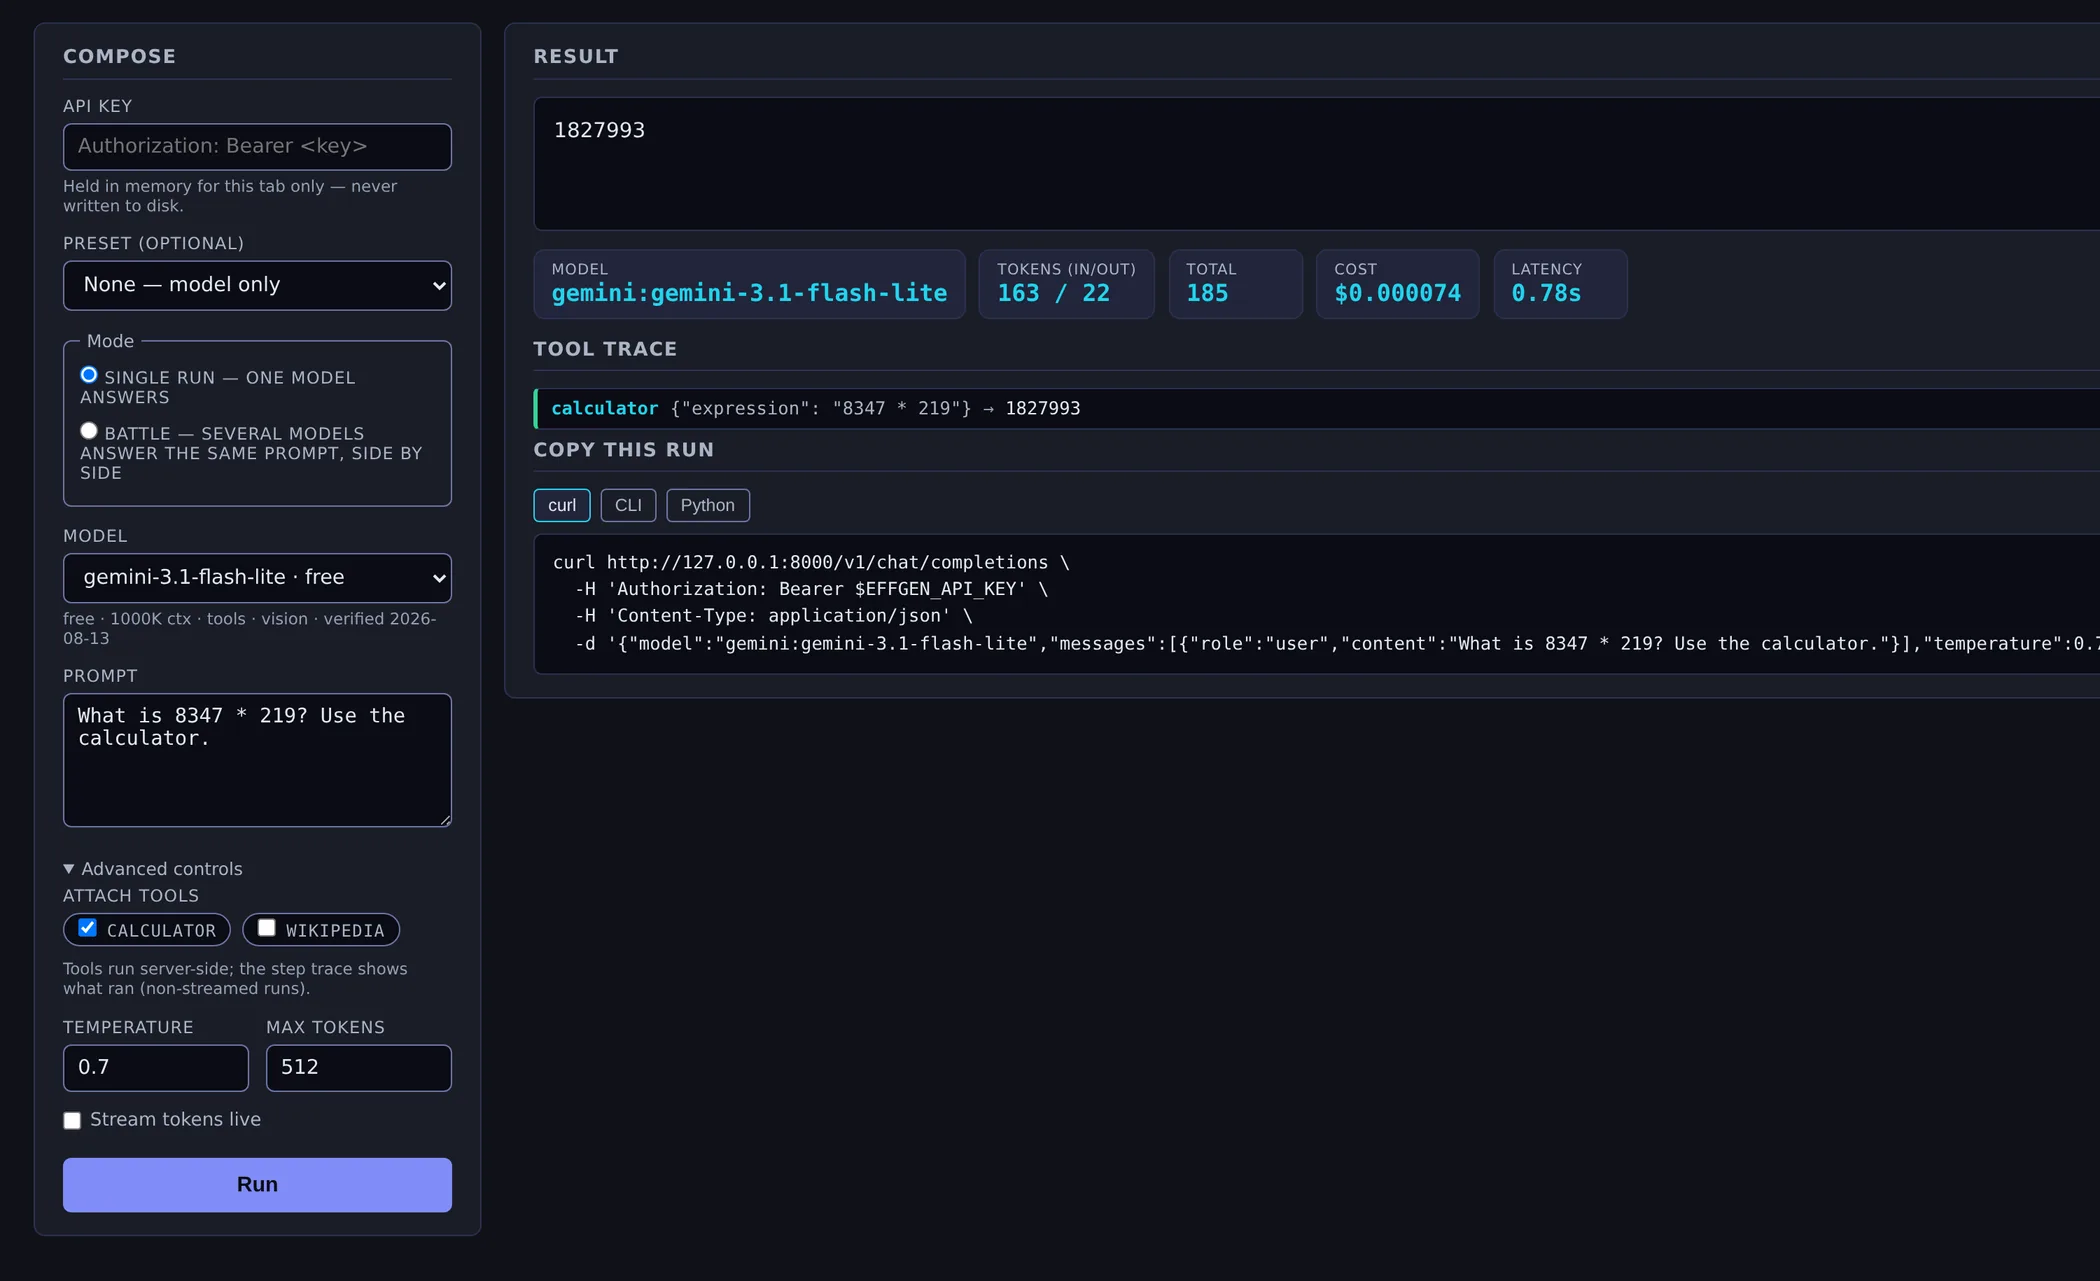
GET /playground · one run of the prompt shown, with the calculator attached and streaming off
the trace of the run aboveSingle run is one model answering. Battle sends the same prompt to every contender at once and lays the answers out side by side with each model’s own tokens, cost and latency — so a battle spends once per model, which the form says before you press Run.
The answer box appends deltas while a stream is open and marks itself busy for the duration, so a screen reader hears the answer once rather than hearing it re-read on every token. A battle grid is not a live region at all; the verdict is, and it is stated once.
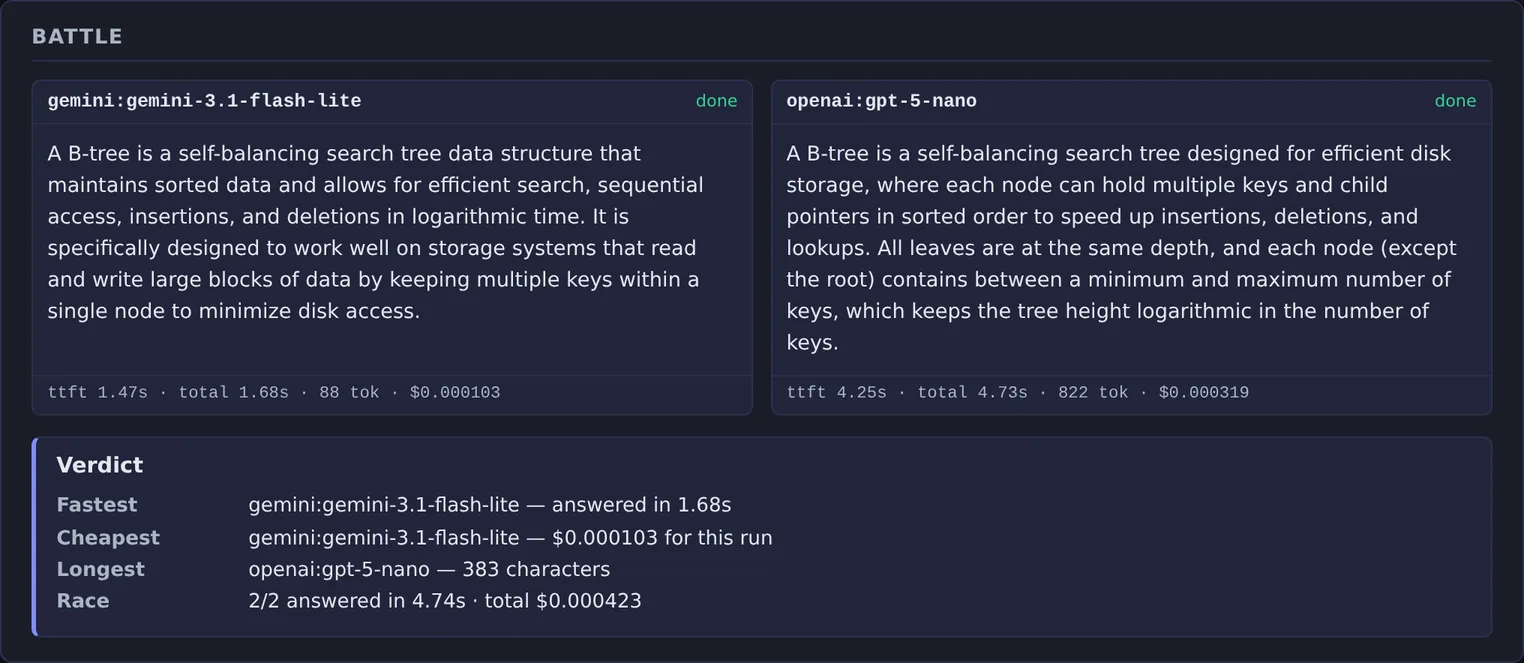
battle mode with two contenders on one promptThe three forms below are what the Copy button put on the clipboard after the run in the figure above — read back out of the page, then run. The model id, the tools, the temperature and the token cap are the ones the form was set to, so what you copy is the run you just watched.
curl http://127.0.0.1:8000/v1/chat/completions \
  -H 'Authorization: Bearer $EFFGEN_API_KEY' \
  -H 'Content-Type: application/json' \
-d '{"model":"gemini:gemini-3.1-flash-lite","messages":[{"role":"user","content":"What is 8347 * 219? Use the calculator."}],"temperature":0.7,"max_tokens":512,"tools":[{"type":"function","function":{"name":"calculator"}}]}'1827993
usage: {'prompt_tokens': 163, 'completion_tokens': 22, 'total_tokens': 185}effgen run 'What is 8347 * 219? Use the calculator.' -m 'gemini:gemini-3.1-flash-lite' -t calculator --temperature 0.7 --max-tokens 512╭─────────────────────────────── Agent Response ───────────────────────────────╮ │ 1827993 │ ╰──────────────────────────────────────────────────────────────────────────────╯ ✓ Done in 2.7s · 1 tool · 183 tokens · $0.000073 1 tool step — run with --trace to see the timeline
from effgen import Agent
from effgen.core.agent import AgentConfig
from effgen.tools import get_registry

reg = get_registry()

agent = Agent(AgentConfig(
    model="gemini:gemini-3.1-flash-lite",
    tools=[reg.get_tool_sync("calculator")],
    temperature=0.7,
    max_tokens=512
))
print(agent.run("What is 8347 * 219? Use the calculator."))1827993
The Python form needs the provider key in the environment; the command-line form finds it the way effgen always does, and the curl form names the server’s own key as an environment variable rather than carrying one.
The catalog panel carries every model the catalog knows — context window, output limit, input and output price, and what each one can do — with a search box, provider and capability filters, a sort and paging. It is the same catalog effgen models browse reads.
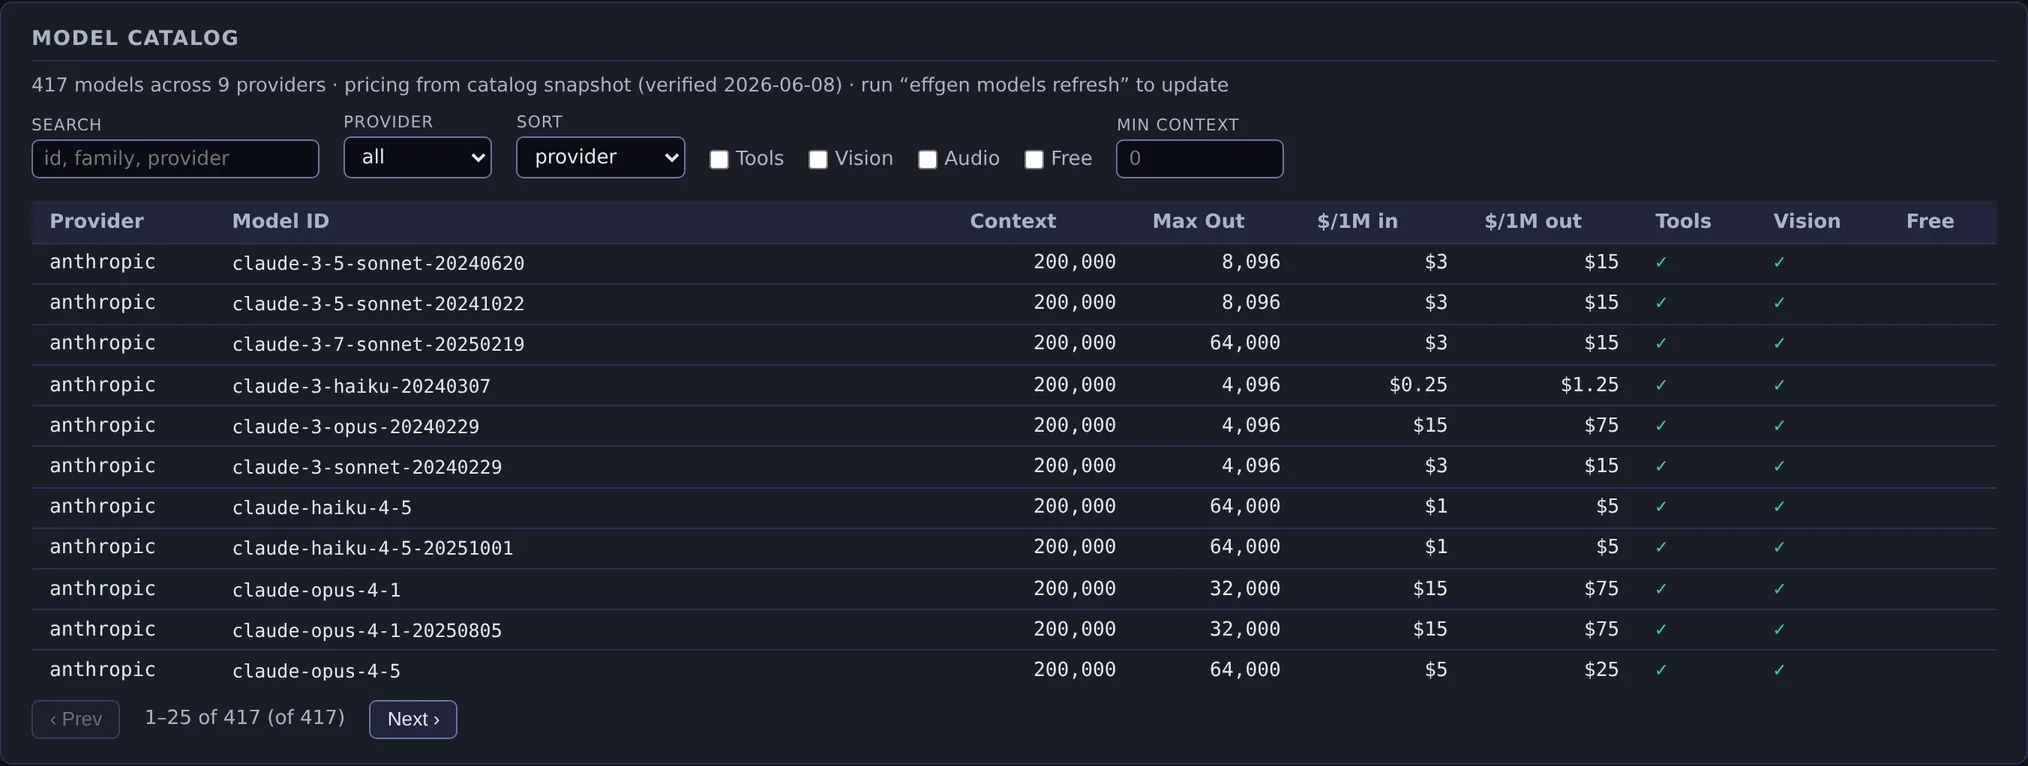
GET /dashboard/catalog.json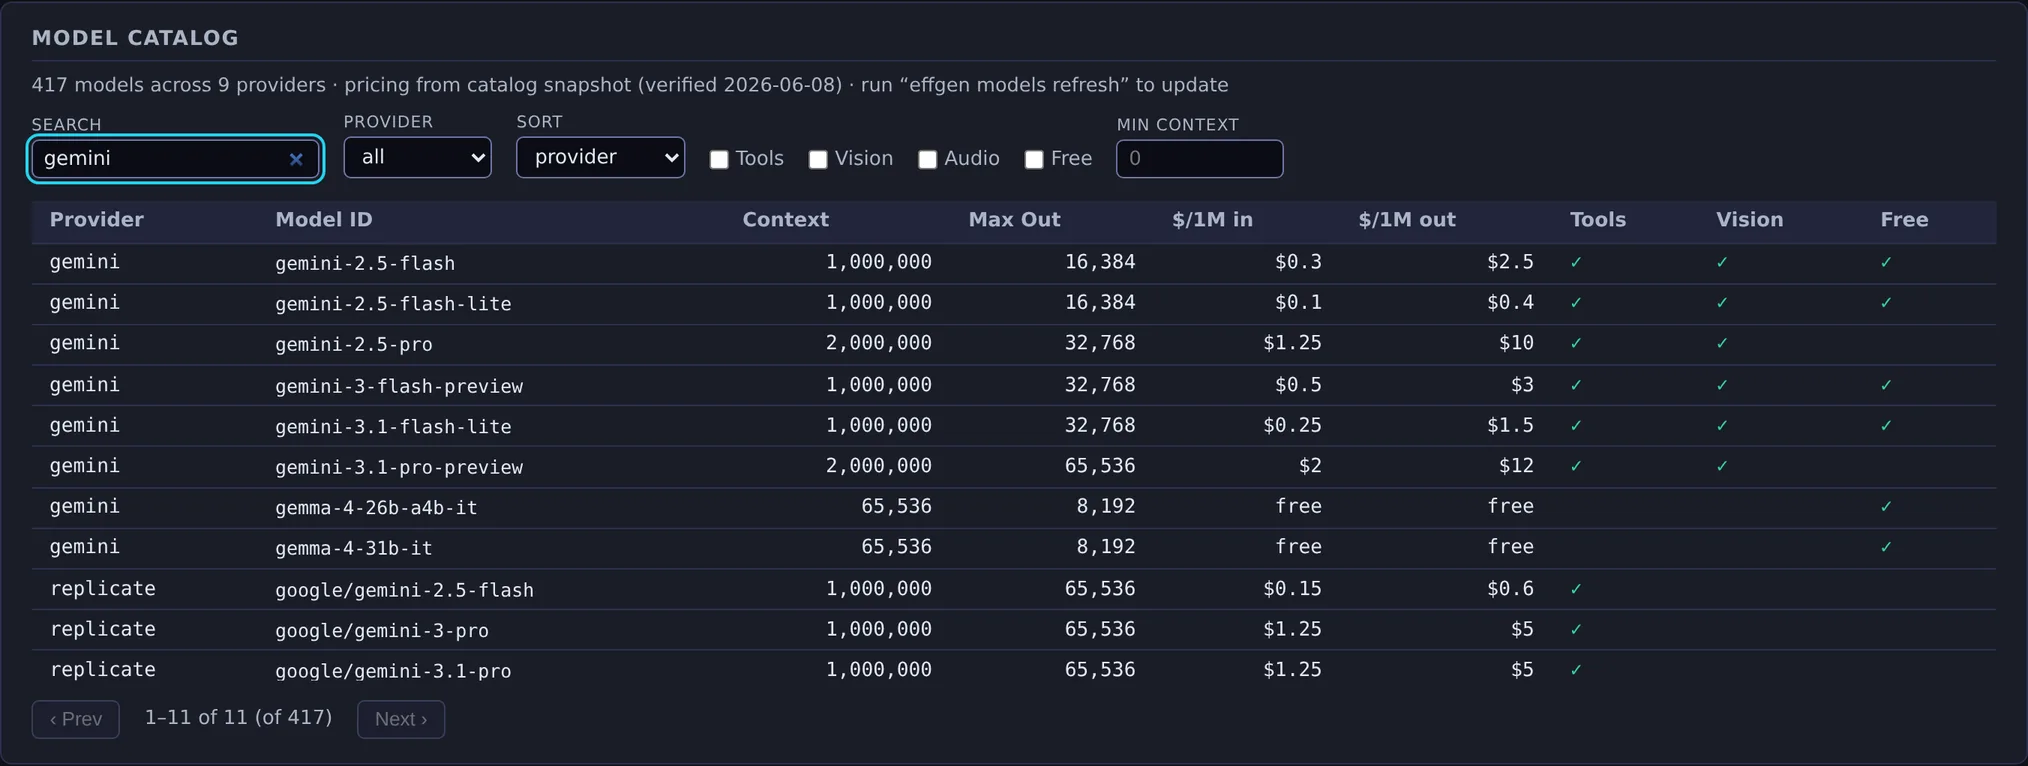
the catalog panel, filtered in the pageThe providers behind that table, what each is good for, the pricing rules the panel follows, and the same catalog on the command line are on the models page.
Any model, anywhereAgents and the tools they reached are nodes; delegation, handoff and tool use are edges. It is built from the durable run store plus the buffered spans, so a team run from a script or the command line appears here too — not only work done inside the server process.
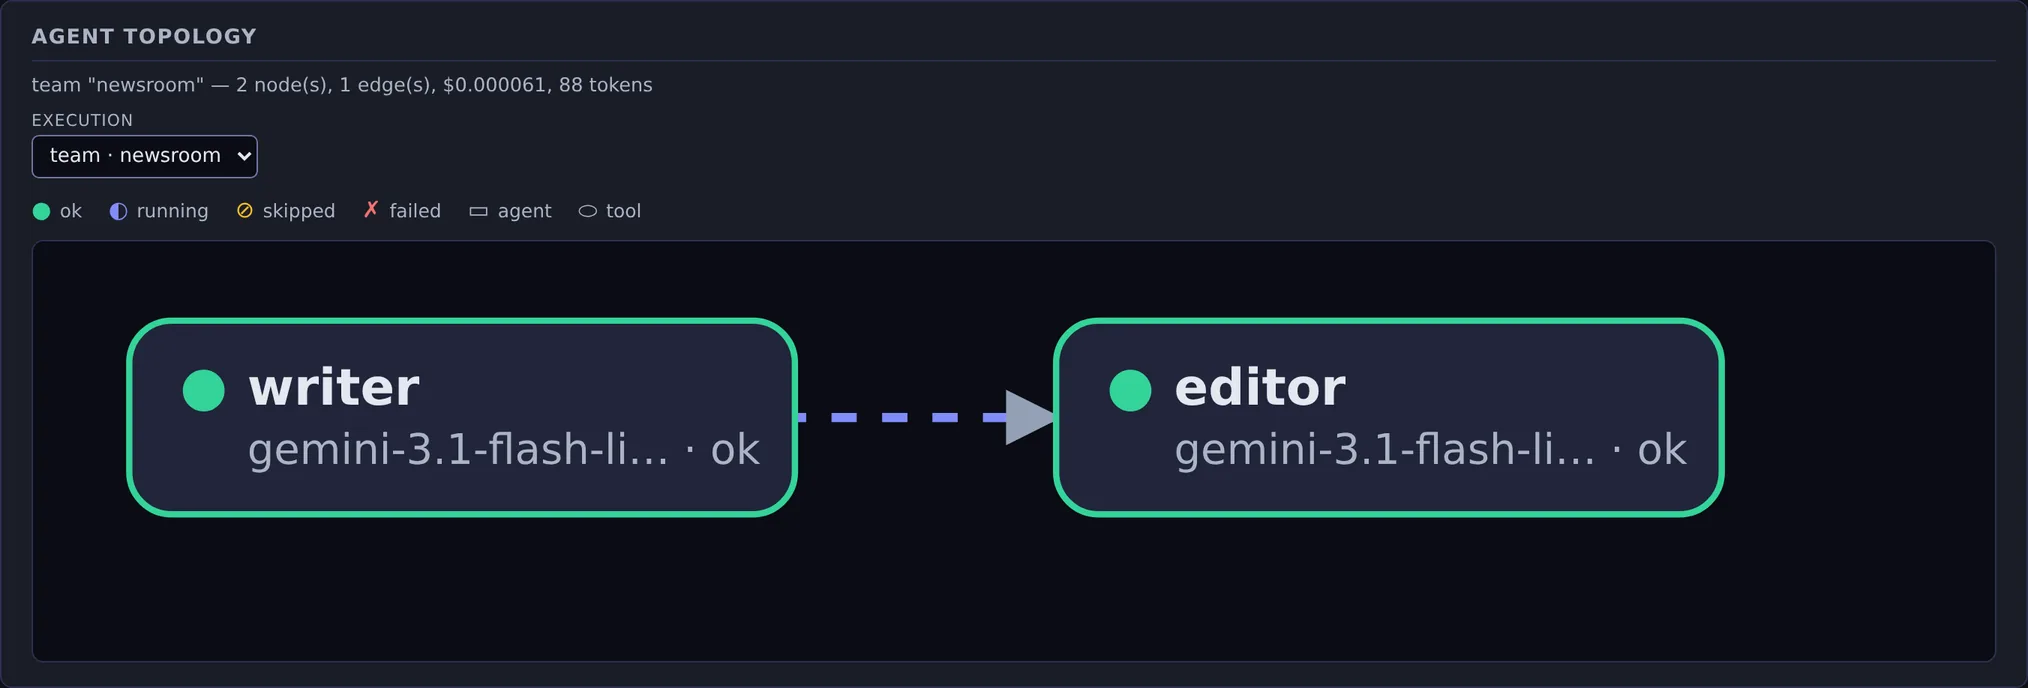
GET /dashboard/topology.jsoncurl -s 'http://127.0.0.1:8000/dashboard/topology.json?limit=1' \
| jq '.executions[0] | {id, kind, name, status, cost_usd, tokens, edges}'{
"id": "ea8b59437040",
"kind": "team",
"name": "newsroom",
"status": "ok",
"cost_usd": 6.1e-05,
"tokens": 88,
"edges": [
{
"source": "writer",
"target": "editor",
"kind": "handoff",
"count": 1
}
]
}executions is empty until something multi-agent has run — the panel says so rather than drawing an empty canvas. The graph is inline SVG the page builds itself; no graph library is involved.
curl -N -s http://127.0.0.1:8000/dashboard/spans | head -1data: {"ts": "05:59:32", "name": "effgen.agent.run api:openai:gpt-9-does-not-exist", "kind": "agent", "agent": "api:openai:gpt-9-does-not-exist", "tool": null, "model": null, "duration_ms": 61.8, "status": "error", "error": "openai error (model='gpt-9-does-not-exist'): The model `gpt-9-does-not-exist` does not exist or you do not have access to it. Did you mean: gpt-5-mini, gpt-5-nano, gpt-4o-mini? ...", "note": null, "run_id": "20f57f459322", "offset_ms": 0.0, "execution_id": null, "execution_kind": null, "execution_name": null, "parent_agent": null, "role": null}kind is agent, model, tool or router, and the matching field names what the span timed — read those rather than parsing name, which is the display label. A run that reports a failure without raising is recorded here as an error, which is how the timeline above knows to draw it as one.
Ctrl-K opens it on either page. It searches four groups built from data the page has already loaded, so it finds a stored run by its task text and a model by its capability without another request.
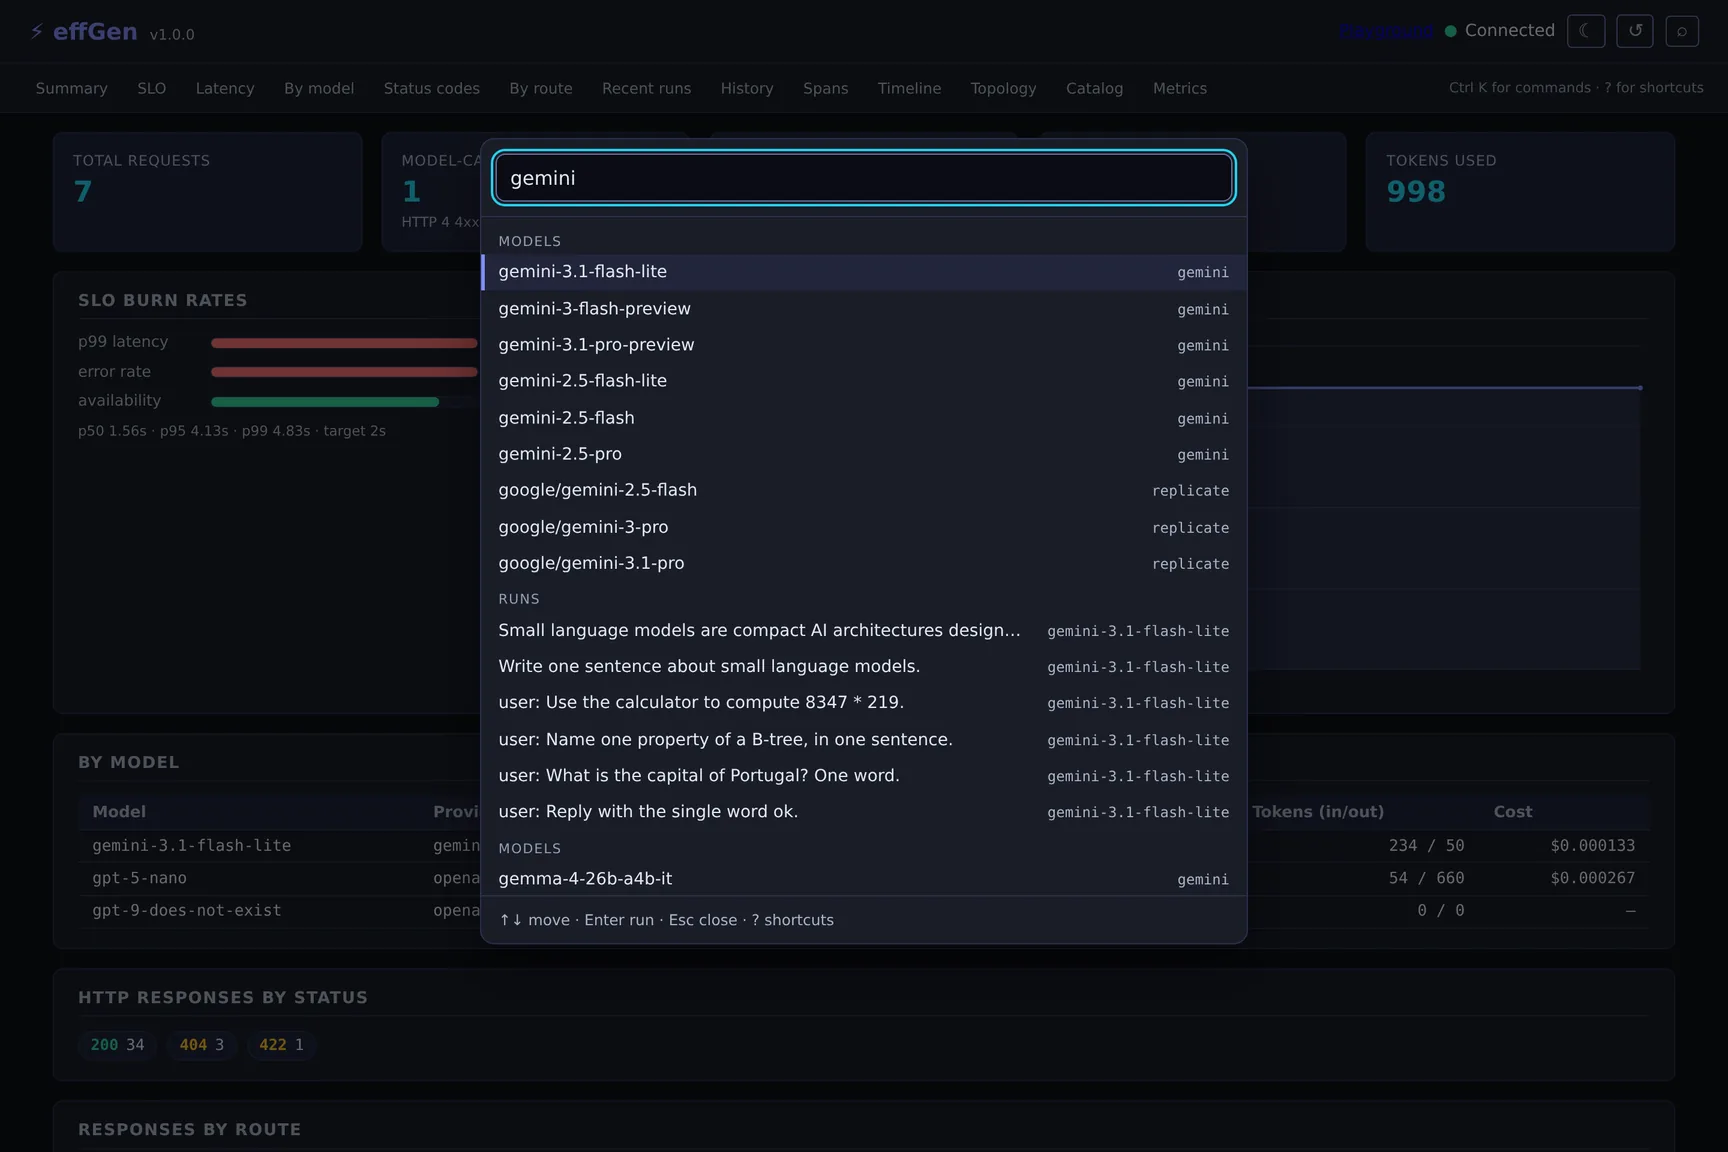
Ctrl-K, then typing cost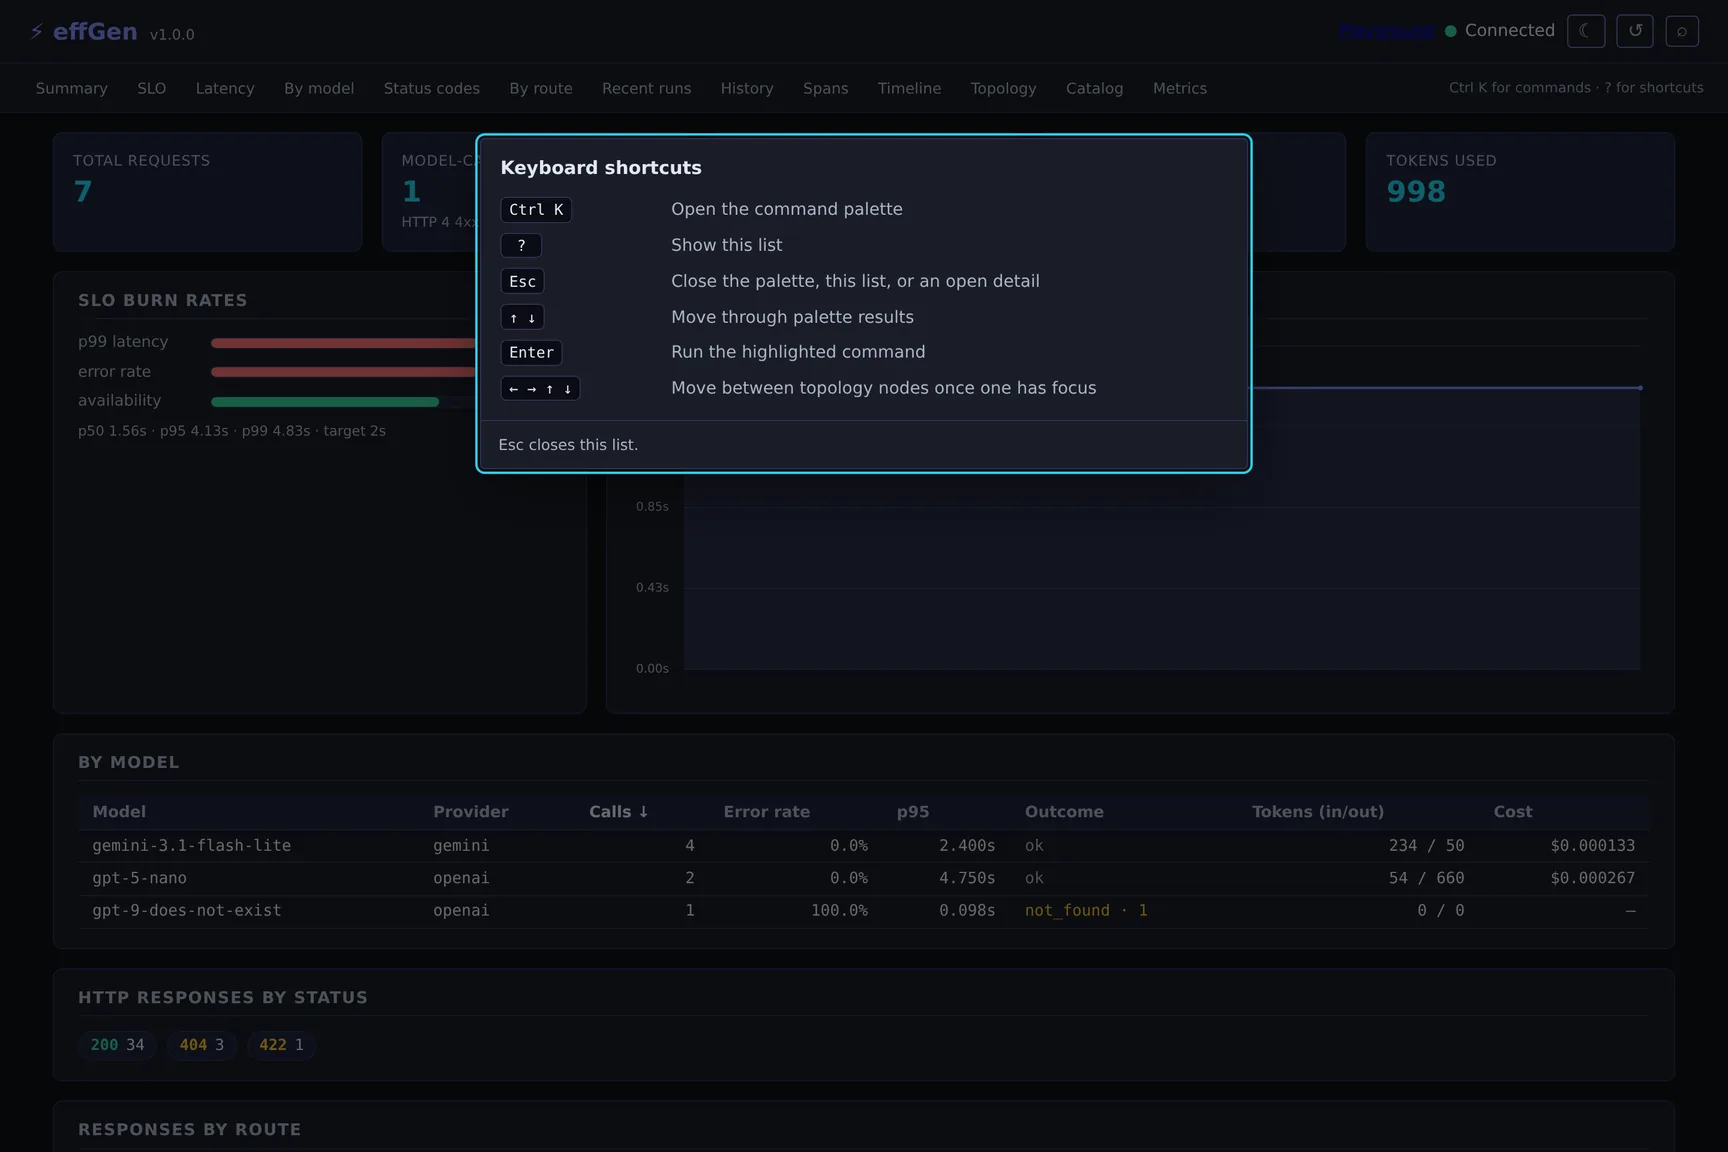
pressing ?every panel on this surface, plus the other surface
switch theme, refresh, clear or pause the span stream, focus a search box
stored runs, matched on task text, model, status or run id — selecting one opens its detail
the catalog, matched on id, provider, family or capability — selecting one filters the table
Focus on a run’s disclosure button stays on that button when the poll rebuilds the history table, and the topology graph behaves the same way. If the run is no longer listed, focus moves to the history panel rather than to the top of the document.
A jump row under the header links to every panel. Selecting one — from the row or from the palette — scrolls to it and moves focus into it, so the next Tab continues from there.
Every value the page writes goes through a write-if-changed rule, so an idle dashboard is silent instead of re-reading five cards, the SLO line and the connection status every five seconds.
A sortable header is a button inside its <th>, exactly one header carries aria-sort, and the new order is spoken. Smooth scrolling is skipped for a visitor who prefers reduced motion, and the theme choice is stored under one key shared by both surfaces.
Both surfaces are 8 files inside the effgen package, 184 kB in total. There is no CDN script, no external stylesheet, no font host and no remote image, so the pages render the same on an air-gapped host as they do on a laptop. That is not a promise, it is a test.
| File | Type | Description |
|---|---|---|
dashboard/static/index.html | — | 18,558 bytes |
dashboard/static/app.js | — | 62,483 bytes |
dashboard/static/style.css | — | 18,381 bytes |
playground/static/index.html | — | 7,104 bytes |
playground/static/app.js | — | 42,275 bytes |
playground/static/style.css | — | 12,648 bytes |
webui/static/webui.js | — | 21,641 bytes |
webui/static/webui.css | — | 5,305 bytes |
Shipped inside the package. The two webui files are the shared keyboard layer, served to both surfaces under the access rule of whichever page loaded them.
# what the shipped files reference — the framework's own check
python -m pytest -q \
  "tests/dx/test_dashboard.py::TestStaticFiles::test_no_external_assets" \
  "tests/dx/test_playground.py::TestStaticFiles::test_no_external_network_hosts" \
  "tests/dx/test_web_palette.py::TestSharedAssets::test_no_external_asset_reference" \
"tests/dx/test_dashboard.py::TestStaticFiles::test_latency_chart_drawn_locally".... [100%] 4 passed in 3.76s
The first three scan every shipped file for an absolute or protocol-relative URL; a same-origin path such as /dashboard/data.json is fine, anything else fails the build. The fourth is why there is no chart library: the latency chart has to be drawn on a canvas.
A file scan proves nothing about a page that builds a URL at run time, so the surfaces were also driven by a real browser with every request it made recorded. Loading /dashboard, waiting through a poll cycle and then loading /playground produced 23 requests, of which 0 left the server.
The one absolute URL anywhere in the shipped files is http://127.0.0.1:8000, printed inside the playground’s copy-as-curl snippet. It is text the page displays, not a request it makes.
effgen serve binds loopback, serves the OpenAI-compatible API, the dashboard and the playground from one application, and is never unauthenticated: with no key configured it mints an ephemeral one and prints it once.
# local viewing: no auth, and the data routes open for the page
EFFGEN_DEV_MODE=1 EFFGEN_PUBLIC_DASHBOARD=1 effgen serve --port 8000

# then
open http://127.0.0.1:8000/dashboard
open http://127.0.0.1:8000/playground{"status":"ok","version":"1.0.0"}--host 0.0.0.0 exposes it on every interface, which is why the help text tells you to set EFFGEN_API_KEY first. effgen top reads the same server’s /dashboard/data.json from a terminal.
| Flag | Type | Description |
|---|---|---|
--host HOST | — | Host to bind to (default 127.0.0.1, loopback-only). Pass --host 0.0.0.0 to expose on all interfaces (set EFFGEN_API_KEY first). |
-p PORT, --port PORT | — | Port to bind to |
--rate-limit N | — | Requests/minute per client IP (overrides EFFGEN_RATE_LIMIT; 0 disables). Health probes are always exempt. |
--trust-proxy | — | Trust the first X-Forwarded-For hop as the rate-limit client IP (overrides EFFGEN_TRUST_PROXY). Enable only behind a reverse proxy that sets/overwrites this header — otherwise any caller can spoof it to bypass the rate limit. |
effgen serve --help · effGen 1.0.0
| Variable | Type | Description |
|---|---|---|
EFFGEN_API_KEY | — | static API key (Bearer or X-API-Key). If unset and not in dev mode, an ephemeral key is minted and printed once — never unauthenticated. |
EFFGEN_DEV_MODE=1 | — | disable auth (loud warning; local dev only). |
EFFGEN_RATE_LIMIT | — | requests/minute per client IP (0 disables; health probes are always exempt). Or use --rate-limit. |
EFFGEN_TRUST_PROXY=1 | — | trust the first X-Forwarded-For hop as the rate-limit client IP (default: off — the raw socket peer is used, since a caller can set that header to anything). Enable only behind a reverse proxy that sets/overwrites it. |
EFFGEN_CORS_ORIGINS | — | comma-separated allowed origins (default: none; cross-origin is fail-closed for a backend API). |
EFFGEN_OIDC_ISSUER / EFFGEN_OIDC_CLIENT_ID | — | enable OIDC/JWT auth instead of a static key. |
EFFGEN_PUBLIC_METRICS=1 | — | serve /metrics without auth (default: auth). |
EFFGEN_PUBLIC_DASHBOARD=1 | — | serve /dashboard/data.json + /dashboard/spans without auth, for local viewing (default: auth; the /dashboard page itself always loads, but its data calls 401 without this or an API key). |
EFFGEN_MODEL_POOL_SIZE | — | loaded models kept warm (default 4). |
EFFGEN_NO_DOTENV=1 | — | skip the .env filesystem search entirely, so only environment variables the orchestrator set are visible (EFFGEN_DOTENV=none is equivalent). |
effgen serve --help · effGen 1.0.0
The static shell is public so the page can render and ask for a key. The 5 data routes are authenticated by default and answer without one in the same typed envelope every other error uses — so a dashboard that shows nothing tells you why, instead of showing zeros that look like a quiet system.
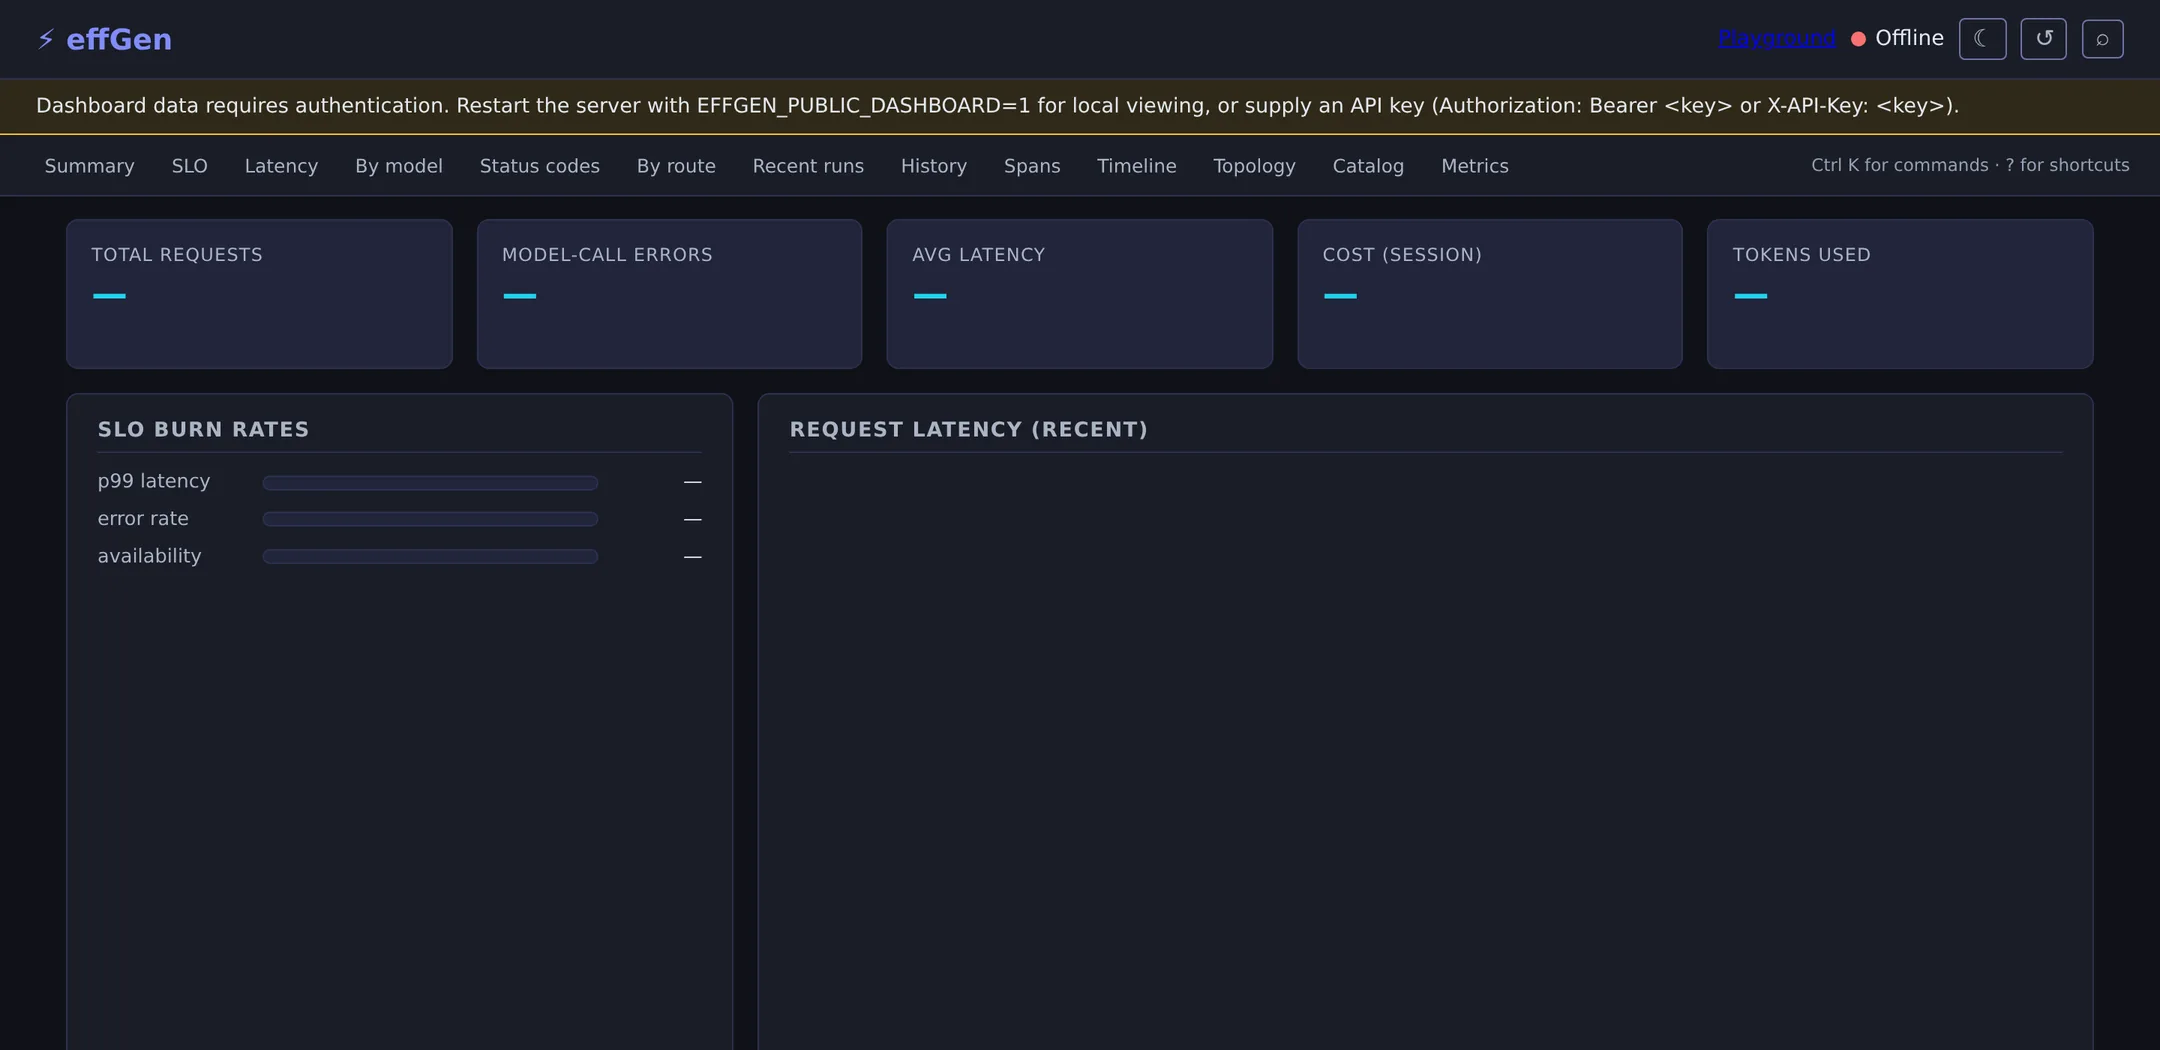
the same page against a server started with no key configuredcurl -s http://127.0.0.1:8000/dashboard/data.json | python -m json.tool
curl -s -o /dev/null -w '%{http_code}\n' http://127.0.0.1:8000/dashboard/data.json
curl -s -o /dev/null -w '%{http_code}\n' http://127.0.0.1:8000/dashboard{
"error": {
"message": "Missing API key (send 'Authorization: Bearer <key>' or 'X-API-Key: <key>')",
"type": "invalid_request_error",
"param": null,
"code": "invalid_api_key"
}
}
401
200The page itself is 200 and the data is 401, which is the split that lets the shell render and prompt. EFFGEN_PUBLIC_DASHBOARD=1 opens the data routes for local viewing; in a shared deployment they stay closed and access is restricted at the ingress.
What each panel measures, the shape of every response, the span and topology payloads, the keyboard table, the accessibility guarantees and the tests that hold them, and record_run for an integration that bypasses Agent.